Web application to track real-time education campaigns.
Tackling malaria in Africa
Throughout the month of April, we saw the largest coordinated effort of activities that PCVs have ever conducted in the fight against malaria in Africa.
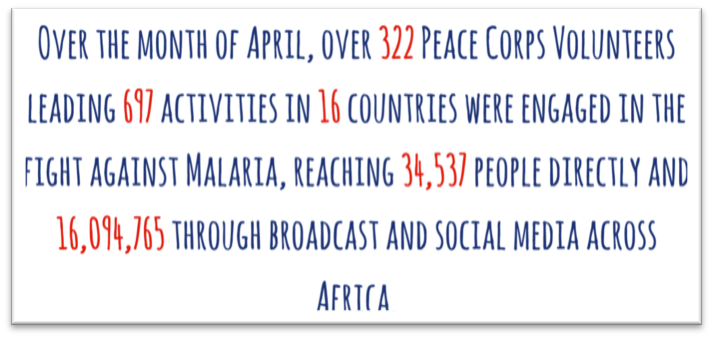
With April 25’s World Malaria Day as a hook, PCVs involved with the agency’s Stomping Out Malaria in Africa (Stomp) initiative used the entire month to rally around the cause. By April 30, over 320 Volunteers had reached more than 16 million people across 23 countries in Africa to raise awareness about malaria in their communities.1
This massive outreach was achieved through local, grassroots-level activities facilitated by PCVs in the communities they serve. Over the course of the month, they led hundreds of diverse activities ranging from traditional community presentations and performances, to novel approaches like soccer tournaments (complete with malaria info sessions!) and media campaigns.
Volunteers engaged in so many activities that it was hard to keep up with the dizzying amount of information at headquarters.
The challenge: monitoring and motivating Stomp-related activities
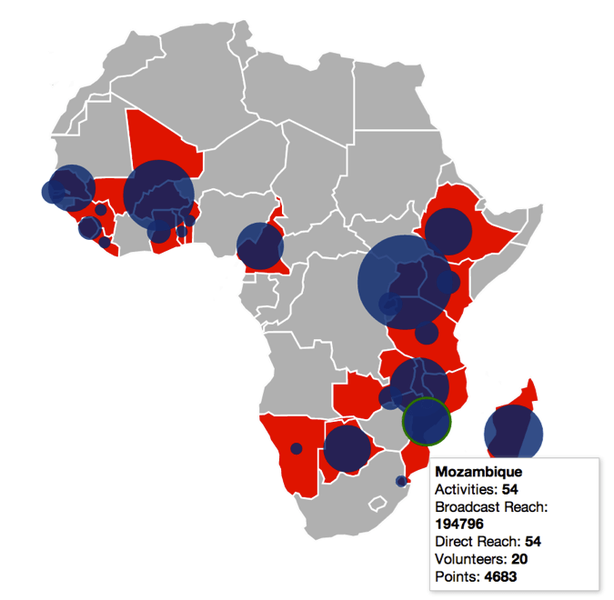
How could we keep track of their efforts to effectively measure their impact and celebrate their success? I wondered if there was a way in which we could use maps in real-time to act as both a public relations tool as well as a motivator for Volunteers participating in the program of Stomp Out Malaria.
I chatted with the ‘The Stomp Team’ to see what was possible. They were also excited about the use of digital mapping because the tool was a way to inspire friendly competition among participating countries.
The idea: automatically updating spreadsheet and corresponding map
Taking what was already happening into account, the idea became that anyone could visit a low-bandwidth-ready site and see a dynamic map of how their particular Stomp country efforts were doing.
For something like this to work, it had to demand as little as possible from the Volunteers themselves. We wanted them to focus on being a Volunteer, not on fiddling with complicated website accounts, interfaces and certainly not on duplicating their efforts into a new data-capturing system.
Building the platforms and connecting the pipes
After some research, I opted to use Google’s own API from the results of the Google Form that Volunteers were already using (with the coordination of an established point-of-contact Volunteer in each country). Using this API method, which was essentially a digital Lego connector, I was able to mold the data format to fit my map.
The key to the entire project was in adapting an open-source project that had already done the heavy lifting on the more complicated back-end connectors between the Google API and an external website like ours. This project, Sheetsee, paved the way forward and made what could have been a 300-hour effort into a mere three hours. The map went through several iterations during April as the Volunteers and Stomping Out Malaria team would come back with thoughts for improving, modifying and adding functionality.
 Screenshot of the map, hovering over Mozambique to see more information
Modifying the stock solution to fit our needs
For example, we realized that, although maps are great at turning complex data into something readable, it didn’t quite convey it quickly enough. To achieve this, I simply built in an update so the map would refresh its numbers as the Volunteers updated theirs. 
In the end, it was this simple sentence feature that proved to be the most engaging.
How did we do?
This project was a success not only because of the ways it allowed people around the world to see the breadth and depth of Peace Corps Volunteer engaged in malaria prevention, but also for how it demonstrates how a government agency can leverage open-source tools and technology to quickly put useful information into the hands of those who can benefit the most.
-
This number should be taken with a grain of salt, as some PCVs were being pretty generous with how they were measuring the reach of their projects through things like radio programs. ↩
