Designing a Dashboard Infographic
I was asked recently to do a concept for what one-page infographic for a particular Peace Corps post related to the Returned Volunteers (RPCVs) that have served there.
I started with Bolivia, as it was a request for that country’s data that got the whole ball rolling.
There are a lot of ways to go with this, and my hope was that putting something — anything on the page, would be helpful in the long run.
I played around with drawing what I thought would work, and in parallel started discussions with folks around not only what would be useful, but in what kind of state the data is in around this stuff.
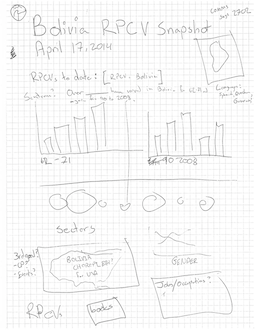
As is often the case with these types of projects, I knew that the visualization and layout would be the easy bit — it was assembling, cleaning, and coordinating the data that would be more challenging. Not only that, but doing it in such a way as to lay the groundwork for future asks of this type, rather than just trying to suss out the data for this one particular request of Bolivia.
 {: style=“border: 2px solid gray”}
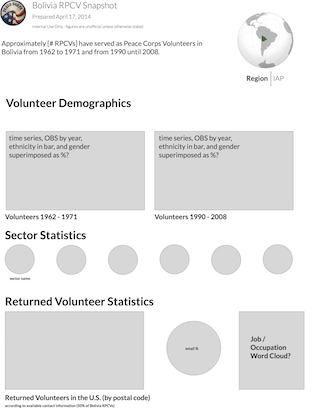
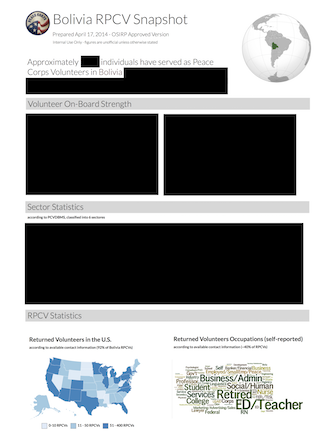
After some back and forth with a couple of different offices who wanted to own the data but not actually vouch for its authenticity (see my ‘redacted’ version below that seemed to help lighten the mood… : )), we finally landed on something that could work.
 {: style=“border: 2px solid gray”}
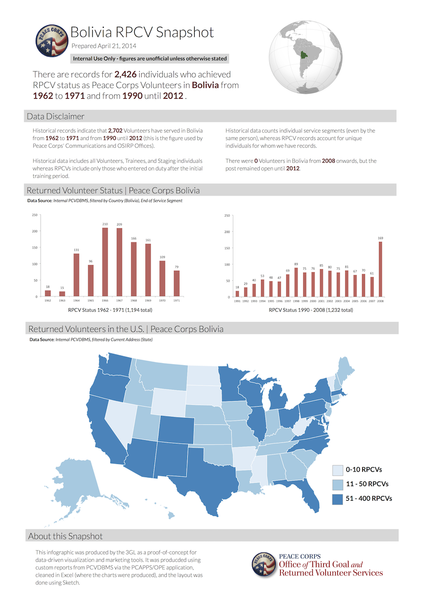
Eventually, by inserting a plethora of disclaimers about the reliability of the data, we were able to tease out an accurate sentence, bar charts for PCVs in Bolivia by year, a very basic choropleth of RPCVs living in the US who served in Bolivia (part of the original ask), and some spec details about who created it and why.
It’s not perfect, but it’s a start.
 {: style=“border: 2px solid gray”}